Continuously scanning the market is a relevant practice among marketers to create and sustain the competitive advantage of their destinations. Regular monitoring of market conditions and competitors’ strategies is a valuable support to the fine-tuning of short- and medium-term strategies. Continuous and structured collection of market data beyond market scanning allows both the identification of changes over time and the evaluation of the present in the context of past occurrences.
\n
In as turbulent a year as the one just gone, the availability of strategic information collected in a structured manner provides crucial support to decision-makers acting under the pressure of shrinking demand. In a tougher competitive environment, price-cut strategies have been seen by several destinations as the only option to stimulate demand. In Spain for instance, a country facing a drop of 10% in Britons’ tourism demand amid a drop in the value of the Pound[1], a price war started across hotels, car rentals and the transport sector[2]; in Germany the political scene has been livened up by the proposal of reducing VAT for hotels, to enable the sector to reduce rates. But this doesn’t apply to all cities: even though tourists’ consumption became more frugal, the price of tourism-related services in Rome did not drop this year. As a result, the puzzle of prices across city destinations may be different from what existed before the crisis.
\n
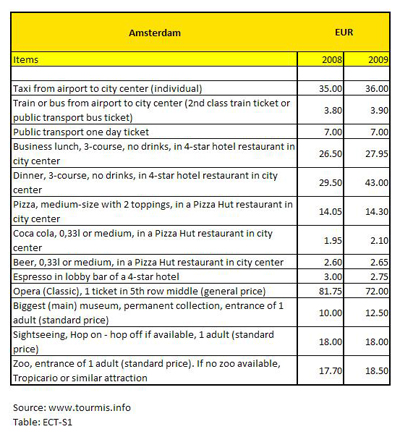
For European city managers facing the current economic downturn, benchmarking and monitoring of tourism-related prices plays a key role in drawing up effective strategies, which will determine their destination’s positioning in a post-crisis scenario. The City Break Shopping Barometer initiative, launched by the ECM Research & Statistics Group in 2009, is becoming a valuable resource for analyses of this kind: entering its second year, the project will offer not only the opportunity to benchmark the price level of tourism-related services across cities in Europe, but will also begin to return trend data. The 20 destinations which joined the project in 2009 will now be able to monitor changes in price levels within their destination and against their competitors (see fig. 1).
\n
\n
\n
\n
Fig. 1 Price comparison in Amsterdam – 2008 and 2009
\n
\n
\n
All ECM members are invited to join the project from January 2010. New project members can immediately benefit from the newly implemented benchmarking features for the current year and can start monitoring trend changes in the succeeding periods. The
ECM City Break Shopping Barometer data collection and analysis functions are easily accessible from the
TourMIS platform (
www.tourmis.info). The City Break Shopping Barometer section can be accessed from the URL
www.tourmis.info, after logging in
[3].
\n
\n
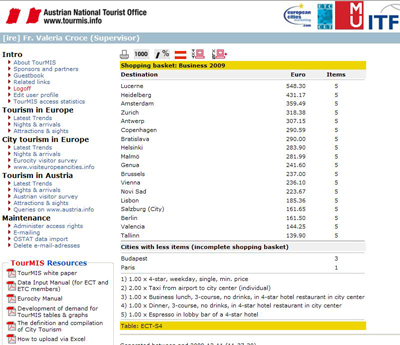
By clicking on the ‘Nights & arrivals’ link in the ‘City tourism in Europe’ menu and selecting the ‘Data Entry’ link in the top right-hand corner, it is possible to access (the link to) the ECM City Break Shopping Barometer data entry section. This link gives access to an initial screen where the name of the destination (for which the inputter has data input rights) is displayed. The state-of-the-art methodology, which is explained in detail in the ECM City Break Shopping Barometer Manual (which can be downloaded from the ‘Data Entry’ area), gives clear directions on how to collect and input prices for the most common services used by tourists, for instance accommodation, food and beverages, entertainment and local transport.
\n
\n
\n
\n
\n
\n
Figure 2 – The link to the ECM City Break Shopping Barometer Data Entry in TourMIS.
\n
\n
\n
By collecting prices for their destination and inputting them in
TourMIS, ECM members can make use of a user-friendly interface and of ready-made queries to perform benchmarking analysis. The system supports users with three main functions, which allow them to:
\n
\n
I. rank different items by price within their destination;
\n
II. benchmark individual items across cities;
\n
III. build a segment-specific consumption bundle and compare the aggregate price across cities;
\n
\n
Segment-specific consumption bundles represent the expenditure of visitors during a holiday in terms of type and quantity of service purchased. For instance the following consumption pattern may describe the one-night visit of a business traveller in a European city: a business visitor purchases accommodation service for one night at a 4 star hotel in the city centre, travels by taxi from and to the airport, enjoys a business lunch and an espresso and concludes the visit with a supper consumed at the hotel restaurant. This segment-specific bundle can be easily created in
TourMIS by clicking on the ‘Nights & arrivals’ link in the ‘City tourism in Europe’ menu on the left-hand side and selecting the link ‘Shopping’ from the top menu. On this page, the function ‘Shopping baskets – new/edit/delete’ redirects to a form where the new consumption basket can be created and later edited or deleted.
\n
\n
A segment-specific bundle can be created in just three steps:
\n
\n
– Specify a label for the basket that allows you to identify its contents easily;
\n
– Select one of the hotel services from the drop-down menu (each corresponding to a specific combination of hotel quality, weekly and yearly seasonality and type of use);
\n
– Specify the number of times each item (i.e. service) is used in the time reference of the bundle (which is defined by the analyst and doesn’t have to be entered in the system);
\n
\n
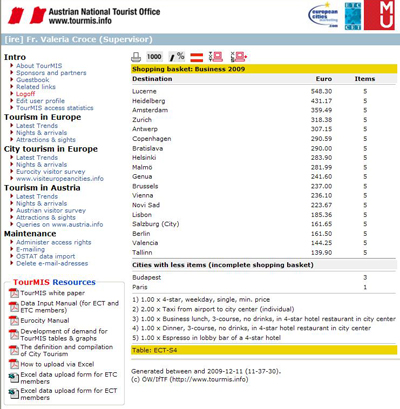
In the example of the business visitor, all services are used once and the taxi service twice (see the specifications at the bottom of fig. 3). By clicking on the button ‘ok’, browsing back to the ‘main menu’ and then clicking on the link ‘
Shopping baskets analysis’ the user can benchmark the aggregate expenditure for this bundle (each item weighted by the number of times it is consumed) against the other cities participating in the project. This tool for price analyses, recently developed by
Prof. Wöber (
MODUL University Vienna), allows
TourMIS users to perform benchmarking analysis on customised consumption bundles in a few mouse clicks.
\n
\n
\n
\n
Figure 3 – Table comparing a segment-specific shopping basket for Business visitors across European cities
\n
\n
\n
The system automatically calculates the aggregated expenditure for the bundle and ranks destinations descendant by level of expenditure. Whenever the price for an item is not provided, the system lists the city separately (in the illustration, this is the case of Budapest and Paris). The system also provides a reminder of the items included in the bundle and the weights associated with them.
\n
The prices collected within the Shopping Barometer reflect the cost to the final consumer of purchasing holiday-related services in different European cities. All the prices include VAT and, where relevant, tourists’ taxes, refer to the regular price for an individual’s consumption, are collected from businesses in the city centre in the local currency and automatically converted into Euros to allow comparisons. Data collection and inputting is neither difficult nor time-consuming. All ECM members are invited to join the initiative by January 2010!
\n
\n
Valeria Croca
\n
Researcher & Lecturer
\n
Modul University Vienna
\n
\n
USAGE RIGHTS AND DATA PUBLICITY
\n
\n
The ECM City Break Shopping Barometer section in TourMIS can only be accessed by TourMIS users with data inputter rights for an ECM destination. If your destination doesn’t have an inputter for the TourMIS system, please contact Ms.
Valeria Croce (e-mail to:
valeria.croce@modul.ac.at). \n
At this stage, the data of the ECM City Break Shopping Barometer are intended for internal use only.
\n
\n
\n
\n
\n
[1] http://www.euromonitor.com/travel_and_tourism_in_spain. Retrieved on 8th December, 2009.
\n
\n
\n
[2] http://www.reuters.com/article/idUSLK42164020090421. Retrieved on 9th December, 2009.
\n
\n
\n
\n


